Letzte Aktualisierung am 07. August 2025.
In der EU melden die Telekommunikationsbetreiber ihren nationalen Behörden wichtige Sicherheitsvorfälle. Zu Beginn eines jeden Kalenderjahres übermitteln die nationalen Behörden eine Zusammenfassung dieser Meldungen an die ENISA. Diese Jahresberichte Telecom Security Incidents enthalten anonymisierte und aggregierte Informationen über wichtige Sicherheitsvorfälle in der Telekommunikation.
2024
Quelle: ENISA – Telecom Security Incidents 2024
Die wichtigsten Ergebnisse des zusammenfassenden Berichts 2024
Die jährliche Zusammenfassung 2024 enthält Berichte über 188 Vorfälle, die von nationalen Behörden aus 26 EU-Mitgliedstaaten und 2 Ländern der Europäischen Freihandelszone (EFTA) übermittelt wurden. Dies ist Anstieg von 20,5 % gegenüber 2023 mit 156 Vorfällen aus 26 EU-Mitgliedstaaten und 1 EFTA Land.
Im Vergleich zu 2022 und 2023 ist 2024 ein deutlicher Rückgang der verlorenen Benutzerstunden zu verzeichnen.
Ein signifikanter Rückgang von mehr als 50 % der verlorenen Benutzerstunden wurde im Jahr 2024 im Vergleich zu 2023. Den erhaltenen Daten zufolge gingen im Jahr 2024 1743 Millionen Nutzerstunden (5) verloren, während 3906 Millionen Nutzerstunden im Jahr 2023 verloren gingen. Dies ist eindeutig eine viel geringere Zahl als im letzten Jahr und liegt wieder auf dem Niveau von vor zehn Jahren. Eine plausible Hypothese ist, dass der Trend auf die Möglichkeit eines verbesserten Ausfallmanagements hinweisen könnte, einer verbesserten Infrastruktur und einer erhöhten Widerstandsfähigkeit des Systems.
Darüber hinaus lassen sich folgende Ergebnisse hervorheben:
- Die höchste Anzahl von Vorfällen (188) wurde bisher im Rahmen der Meldung von Vorfällen im Bereich der elektronischen Kommunikation an die ENISA gemeldet. Trotz des Anstiegs der gemeldeten Vorfälle gab es keinen entsprechenden Anstieg der ausgefallenen Nutzerstunden.
- Die Vorfälle verteilten sich wie folgt: Dienstausfall – 178, sonstige Auswirkungen auf den Dienst – 4, Auswirkungen auf andere Systeme – 1, Bedrohung oder Schwachstelle – 1, Auswirkungen auf die Redundanz – 2 und Beinaheunfall – 1.
- 19,5 % Anstieg der Vorfälle mit sehr großen Auswirkungen von 77 (2023) auf 92 (2024).
- Wichtige Statistiken zu den Ursachen:
- Systemausfälle dominierten weiterhin weitgehend in Bezug auf die Auswirkungen und erreichten 2024 mit 113 Vorfällen einen Anteil von 60 %, was einen leichten Rückgang gegenüber 2023 (61 %) darstellt. Sie waren für 548 Millionen verlorene Nutzerstunden verantwortlich, was fast einem Drittel aller verlorenen Nutzerstunden im Jahr 2024 entspricht.
- Menschliches Versagen führt zu einem leichten Rückgang des Anteils der Vorfälle auf 19 % gegenüber 21 % im Jahr 2023, jedoch gibt es einen mehr als zweifachen Anstieg der verlorenen Nutzerstunden von 181 Millionen auf 402 Millionen im Jahr 2024.
- Vorfälle aufgrund von Naturereignissen stiegen auf 25 und erreichten einen Anteil von 13 %, was zu 605 Millionen verlorenen Nutzerstunden führte, was einer Steigerung von fast dem Neunfachen gegenüber dem Vorjahr entspricht (2023 – 72 Millionen verlorene Nutzerstunden).
- Böswillige Handlungen machten 15 Vorfälle aus, was einem Anteil von 8 % an den Gesamtvorfällen entspricht und zu 184 Millionen verlorenen Nutzerstunden führte, was weniger ist als im Jahr 2023 mit 16 Vorfällen, die 10 % und 214 Millionen verlorene Nutzerstunden ausmachten.
- Wichtige Statistiken zu den betroffenen Diensten
- Mobilfunk und mobiles Internet waren mit 100 bzw. 86 Vorfällen erneut die am stärksten betroffenen Sektoren, mit einem Anteil von 57 % bzw. 49 %, ähnlich wie 2023.
- Der Anteil der Vorfälle im Bereich Festnetz-Internet stieg von 16 % im Jahr 2023 auf 26 % im Jahr 2024.
- Technische Ursachen
- Im Jahr 2024 wurden 41 Vorfälle als Kabelbrüche (23 %) gemeldet, was einem Vorsprung von 10 % gegenüber den beiden nächstplatzierten technischen Ursachen entspricht, nämlich fehlerhafte Softwareänderungen/-aktualisierungen (14 %) und Software Bugs (13 %). Die Positionen von Kabelbrüchen und fehlerhaften Softwareänderungen/-aktualisierungen tauschen sich, wenn wir die daraus resultierenden verlorenen Benutzerstunden berücksichtigen. Fehlerhafte Softwareänderungen/-aktualisierungen führen zu 515 Millionen verlorenen Benutzerstunden, Kabelbrüche zu 331 Millionen.
- Im Jahr 2024 wurden 65 Vorfälle von Dritten als Ausfälle gemeldet, was einem Anstieg von 25 % gegenüber 2023 entspricht, als 52 Vorfälle gemeldet wurden.
- Es wurden keine grenzüberschreitenden Vorfälle gemeldet.

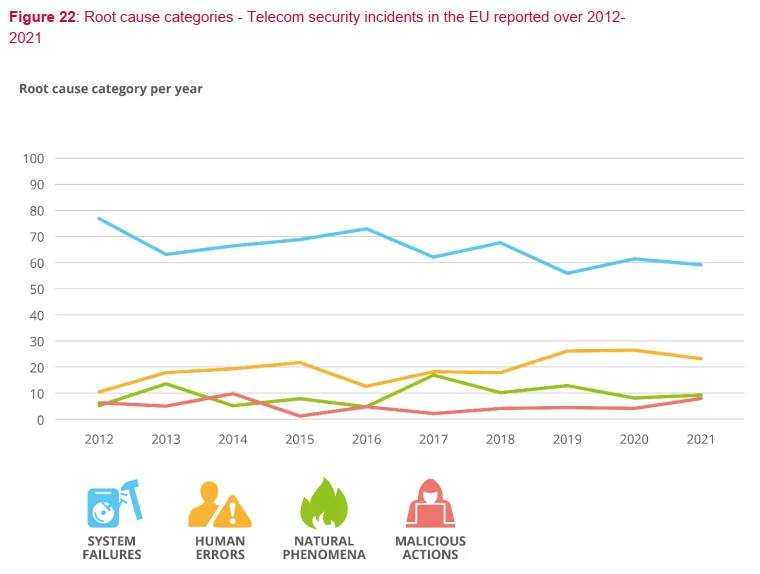
Eine Analyse der Vorfallberichte der letzten Jahre lässt darauf schließen, dass die europäischen Telekommunikationsnetze robuster und widerstandsfähiger werden, da die steigende Zahl der Vorfälle nicht zu einem Anstieg der verlorenen Nutzerstunden geführt hat.
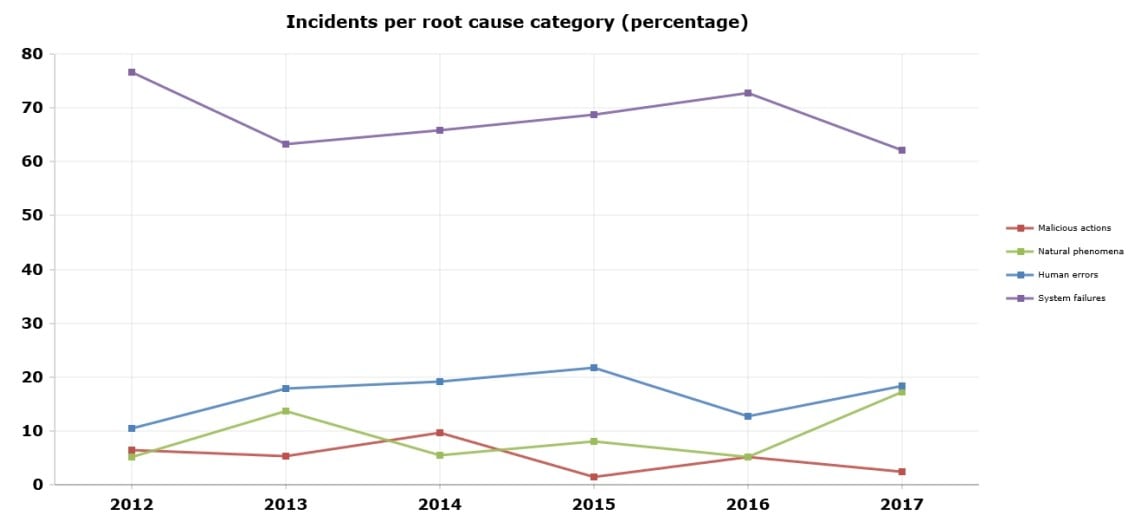
Insbesondere haben sich folgende Trends herauskristallisiert:
- Systemausfälle (blau) sind seit Jahren die häufigste Ursache.
- Böswillige Handlungen (rot) bleiben im Laufe der Zeit relativ stabil und haben nur minimale Auswirkungen, was darauf hindeutet, dass sie nicht die Hauptursache für größere Störungen sind.
- Am stärksten betroffen sind nach wie vor Mobilfunk und mobiles Internet, was seit acht Jahren unverändert gilt.


")

2023
Für 2023 liegt kein öffentlich zugänglicher Bericht vor.
2022
Quelle: ENISA – Telecom Security Incidents 2022
Key findings in 2022 summary report
The 2022 annual summary contains reports of 155 incidents submitted by national authorities from 26 EU Member States and two European Free Trade Association countries.
In 2022, 11 209 million user hours (4) were lost in total, compared to 5 106 million in 2021. This is clearly a much higher number compared to previous years, as we can see in Figure 1. The reason for this is the important increase in incident reports related to Over-The-Top (OTT) services, a recent metric taken on board in the cybersecurity incident-reporting and analysis system since 2021.
Incident reporting confirms the following.
- Mobile telephony and mobile internet were the most impacted sectors, with respectively 52 % and 40 % of incidents.
- Over-The-Top services (OTT) accounted for 26 % of incidents.
- Traditional fixed telephony, fixed internet and broadcasting services continued to drop in terms of incident reports.
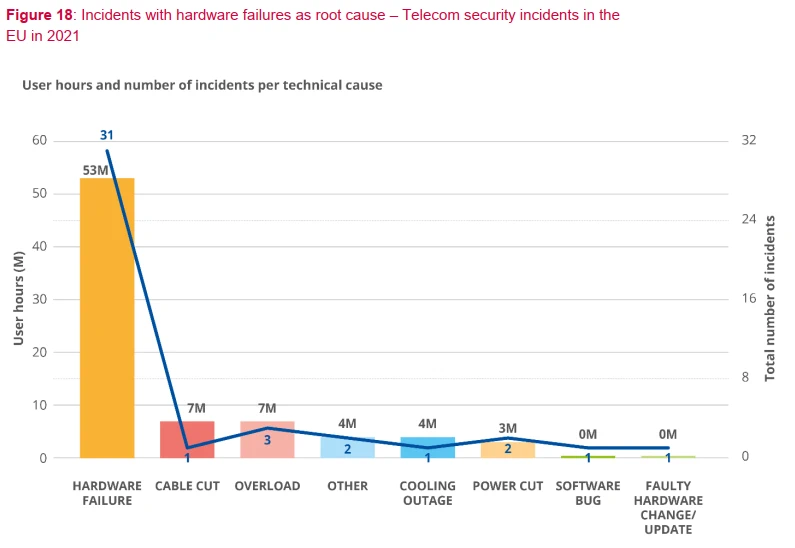
- System failures continued to largely dominate in terms of impact, reaching 72 % in 2022. They globally accounted for 10 481 million user hours lost (against 10 025 million for OTT) compared to 363 million user hours in 2021 and 419 million in 2020. In 2022, 36 incidents (23 % of total system failures) were marked as hardware failures. They resulted in 797 million user hours lost compared to 53 million in 2021. All of them were reported as system failures.
- Human error incidents have steadily decreased since 2020, from 26 % in 2020 to 23 % 2021 and 15 % in 2022. Human error accounted for 135 million user hours lost in 2022.
- Malicious actions accounted for 435 million of user hours lost in 2022, 6 % of that year’s total incidents, compared to 70 million (8% of that year’s total) in 2021 and 13 million (4% of that year’s total) in 2020.
- Five distributed denial-of-service incidents were reported, resulting in 1 million user hours lost.
- The share of incidents due to natural phenomena remained stable, at 6 %. However, the number of user hours lost increased.
- Incidents flagged as failures by third parties represented 23 % of incidents, with a total of 35 incident reports, compared to 22 % in 2021, 29 % in 2020 and 32 % in 2019. Four of them originated from human errors, three from malicious actions and one from natural phenomena.
- Five incidents concerning confidentiality and authenticity (5) were reported, compared to three in 2021.
- One incident concerning impact on redundancy was reported for the first time.
- One incident concerning a near-miss incident was reported for the first time.


2021
Quelle: ENISA – Telecom Security Incidents 2021
Malicious actions doubled in 2021. In 2020, incidents marked as malicious actions represented 4% of the total, a number which rose to 8% in 2021. Moreover, it is interesting to highlight the significant increase in DDoS attacks compared to 2020 when only four such incidents had been reported resulting in 1 million user hours lost. By comparison, in 2021 ten DDoS related incidents were reported, leading to a loss of 55 million user hours. These results are consistent with the findings of the ENISA Threat Landscape that point to an increase in DDoS attacks and a general increase in attacks against availability of services.
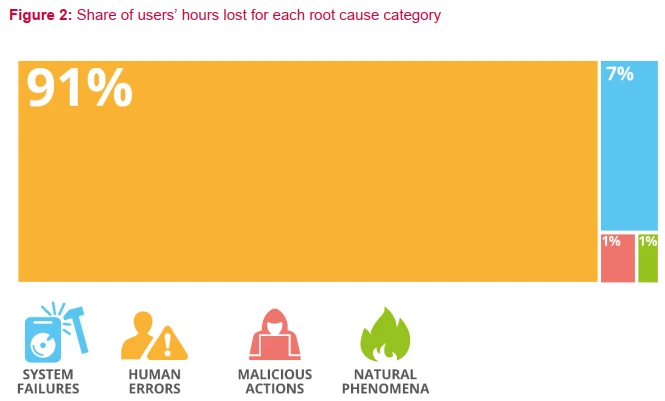
System failures continue to dominate in terms of impact, but the downward trend continues. System failures accounted for 363 million user hours lost, compared to 419 million user hours in 2020. Despite the skewed nature of the 2021 results, it is noteworthy that there was a 14% decrease in user hours lost, whereas in terms of the number of incidents in 2021 they represent 59% of the total compared to 61% in 2020. This highlights the growing maturity of electronic communication providers in handling and containing the impact of system failures.
Incidents caused by human errors remain at the same level as in 2020. Around a quarter (23%) of total incidents have human errors as a root cause (a slight decrease compared to 26% in 2020), however 91% of the total user hours lost have been lost due to this kind of incident. These results however are skewed due to the OTT communication services incident reporting issues mentioned above.
In 2021, there was a noteworthy decrease in incidents flagged as failures by third parties. Only 22% of incidents were reported as being related to third-party failures compared to 29% in 2020 and 32% in 2019. No third-party failures related to malicious actions were reported. Overall, the finding suggests that electronic communication providers have started introducing targeted security controls to better protect their supply chains, echoing the relevant ENISA calls for attention.
It is interesting to note the impact of incidents related to malicious actions on lost user hours. Interestingly, in 2021 lost user hours increased five times (from 13 million lost user hours in 2019 and 2020 to 70 million lost user hours in 2021). While the number of incidents doubled in 2021 compared to 2020, the significant increase in their related impact highlights the need to take further action in containing the adverse effect of such incidents.
2020
Quelle: ENISA
2020 HIGHLIGHTS & Executive Summary – System Failures on the Rise
In 2020, half of the total user hours lost were due to system failures (50%) and almost half was lost due to human errors (41%).
All reports mention user hours lost due to high load caused by the COVID-19 pandemic.
Over the course of 10 years, EU Member States reported a total of 1263 telecom security incidents.
STATISTICS EXTRACTED FROM ANNUAL SUMMARY REPORTING PROCESS 2020
The 2020 annual summary reporting process contains reports of 170 incidents submitted by national authorities from 26 EU Member States and 2 EFTA countries. The total user hours lost, derived by multiplying for each incident the number of users and the number of hours, was 841 million user hours. These numbers are in line with those of previous years, as can be seen in the following graphic.

THE KEY TAKEAWAYS FROM 2020 INCIDENTS
- Faulty software changes/updates are a major factor in terms of impact: In 2020, incidents related to faulty software changes/updates resulted in 346M user hours lost, which corresponds to roughly 40% of the total user hours lost. In this year’s report, we dive into the numbers relating to faulty software changes (see chapter 4).
- System failures continue to dominate in terms of impact: System failures represent around a half of the total user hours lost (419 million user hours, 50% of total). They are also the most frequent root cause of incidents: 61% of the total reported incidents.
- Incidents caused by human errors remain at the same level as in 2019: More than a quarter (26%) of total incidents have human errors as a root cause and 41% of the total user hours lost were due human errors.
- Third-party failures remain at the same level as 2019: Almost a third of incidents were also flagged as third-party failures (29%), ie incidents that originated in a third party, say a utility company, a contractor, a supplier, etc. This number is consistent with 2019, but has tripled compared to 2018, when it was just 9%.
ENISA offers an online visual tool for analysing incidents, which can be used to generate custom graphs. See: https://www.enisa.europa.eu/topics/incident-reporting/cybersecurityincident-report-and-analysis-system-visual-analysis/visual-tool.

Over the last couple of years, we see the following trends:
- System failures continue to be the most frequent cause of incidents (61%), but their average size is trending downwards: Every year system failures have been the most common category of root causes. Since 2016 the average size of these incidents has been decreasing; however, between 2019 and 2020 we observe a slight increase in user hours lost due to system failures, and a corresponding decrease in hours lost due to natural phenomena as well as due to malicious actions.
- Number of incidents stabilizing: The total number of incidents reported is stabilizing at around 160 annually. Over the period 2014-2020, a consistent number of incidents have been reported and this is stabilizing at around 160 incidents per year.
- User hours lost stabilizing at a new low: User hours lost have been stabilizing over the last three years at around 900 million a year. During these three years, stabilization in the number of user hours lost (around 900 million hours lost) was noticeable with the number of incidents approximating 160 each year.
- Malicious actions continue to represent a minority of incidents: Over the reporting period, the frequency of malicious actions was stable (accounting for approximately 5% of incidents per year). Their impact in terms of user hours was stable also.
- Human errors are trending up: The percentage of incidents caused by human errors has been trending up since 2016. In 2020 they accounted for 26% of the total number of incidents.
- Especially in 2020 and because of the COVID-19 pandemic, providers had to deal with major surges and shifts in usage and traffic patterns from the start of the pandemic. This gradually stabilised to what is now considered the new normal. The general take away from the pandemic is that services and networks have been resilient during the crisis, despite major changes in usage and traffic. We should not omit mentioning, however, that some countries pointed out – in the context of ENISA’s relevant information-gathering exercise from the NRAs concerning the status of networks during the first months of 2020 – that there were physical attacks to base stations, masts or other telecommunication equipment, possibly related to theories that 5G can be harmful and even responsible for the COVID-19 pandemic.
Currently the focus of the national authorities for telecom security is on the transposition and implementation of the EECC, which brings several changes. The incident reporting requirements in Article 40 of the EECC have a broader scope including explicitly, for example, breaches of confidentiality. In the context of the new EECC, targeted attacks, involving for instance those using SS7 protocol vulnerabilities, SIM Swapping frauds, attacks using the Flubot malware or even more extended attacks that cause no outages, such as a wiretap on an undersea cable or a BGP hijack, would be reportable under Article 40 of the EECC.
ENISA will continue to work with national authorities as well as the NIS Cooperation group to find and exploit synergies between different pieces of EU legislation, particularly when it comes to incident reporting and cross-border supervision.


2019
„15% of the incidents involved a power cut, but incidents caused by power cuts account for 496 million user hours lost, i.e. more than half of the total impact.“, ENISA, 2019!
2017
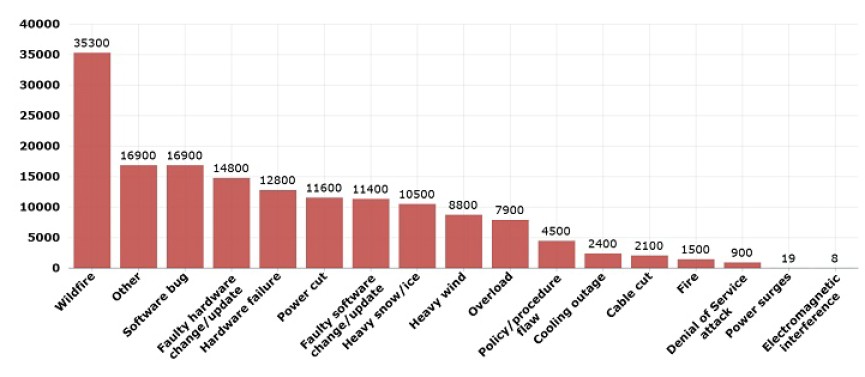
Extremwetterlagen verursachten 2017 fast ein Fünftel der (Telekom)Netzausfälle in Europa
Quelle: www.heise.de
Die europäischen Telekommunikations- und Internetbetreiber meldeten im vergangenen Jahr insgesamt 169 größere Netzausfälle an die Behörden. Dabei wirkten sich immerhin 51 Prozent der Fälle auch auf die Mobilkommunikation aus. Im Schnitt waren eine Million Nutzer von einem einzigen Netzausfall betroffen, berichtet die Europäische Agentur für Netz- und Informationssicherheit ENISA in ihrem jetzt vorgestellten Jahresbericht , der die Meldungen der europäischen Netzregulierungsbehörden zusammenfasst.
System failures are the dominant root cause of reported incidents: Most incidents reported were caused by system failures (62% of the incidents) as a root cause. Often these are hardware failures or software bugs.
Annual Incident Reports 2017, ENISA
62,1 Prozent der Netzausfälle konnten auf Systemversagen zurückgeführt werden, die auf dem Versagen von Hardware sowie auf Softwarefehlern basierten. 18,3 Prozent der Vorfälle gingen auf menschliches Versagen und nur 2,4 Prozent auf kriminelle Handlungen wie Denial-of-Service-Attacken oder Kabeldiebstähle zurück. Diese Zahlen bewegen sich im Rahmen der letzten Jahre.
Unüblich ist jedoch der hohe Anteil von 17,2 Prozent, den Naturphänomene im vergangenen Jahr an den Netzwerkausfällen hatten. Zu diesen Phänomenen zählen starke Schneefälle, Eis, Sturm, Überflutungen und nicht zu kontrollierende Waldbrände. In den drei Jahren zuvor hatten diese nur 5 Prozent der Ausfälle verursacht. Die ENISA erkennt in den Zahlen einen Aufwärtstrend und warnt: „Netzbetreiber in der Europäischen Union werden sich mit Naturphänomenen weiterhin befassen müssen, da Extremwetterlagen aufgrund des Klimawandels häufiger werden.“
Stromausfälle spielen insgesamt mit 22 Prozent eine wichtige Rolle, wobei die ENISA betont, dass in den üblichen Ausfallszenarien Stürme oder Waldbrände als Ursache angenommen werden.
Kommentar
Hier zeigt sich wieder einmal, wie die Realität von unserer Wahrnehmung abweicht. Cyber-Angriff stehen in der Wahrnehmung wahrscheinlich ganz oben. Gleichzeitig sind sie nur für einen sehr kleinen Teil von Infrastrukturausfällen verantwortlich. Siehe dazu auch bereits den ENISA Annual Incident Reports 2015 – Telecom Sector, wo auch das Thema Stromausfall bereits thematisiert wurde. Wir sehen in diesem Bereich bereits im Alltag viele Herausforderungen. Die Frage ist, wie sich das dann alles nach einem weitreichenden Infrastrukturausfall auswirken wird. Hier zeichnen sich umfassende Unsicherheiten ab. Siehe etwa auch Schwachstelle Kondensator
2015
Quelle: www.enisa.europa.eu
Die European Union Agency for Network and Information Security (ENISA) gibt einen jährlichen Bericht zu den IT-Vorfällen im Telekommunikationssektor heraus, die gem. Article 13a durch die Mitgliedstaaten an die ENISA zu melden sind. Der aktuelle Bericht zeigt einmal mehr auf, dass die Hauptursache von Systemausfällen nicht auf Cyber-Angriffe oder Schadsoftware zurückzuführen ist. Siehe etwas dazu auch den Bericht Power Supply Dependencies in the Electronic Communications Sector (2013).
Annual Incident Reports 2015
Analysis of Article 13a annual incident reports in the telecom sector
Executive Summary
For the fifth year, ENISA publishes the annual report about significant outage incidents in the European electronic communications sector, which are reported to ENISA and the European Commission (EC) under Article 13a of the Framework Directive (2009/140/EC), by the National Regulatory Authorities (NRAs) of the different EU Member States.
This report covers the incidents that occurred in 2015 and it gives an aggregated analysis of the incident reports about severe outages across the EU. This report does not include details about individual countries or providers. The aim of the incident reporting scheme is to provide transparency to society and to learn from past incidents in the electronic communications sector in order to systematically improve the security in the networks and services.
This report provides an overview on an aggregated level of what services and network assets are impacted and the root causes of the incidents. Conclusions on the main patterns of incidents are drawn, contributing to discussions at policy level on strategic measures to improve the security in the electronic communications sector.
The main conclusions from this year’s incident reporting are the following:
- 138 major incidents reported: This year 21 countries including two EFTA countries reported 138 significant incidents that occurred in 2015 while 9 countries reported they had no significant incidents.
- Mobile internet most affected service: In 2015 most incidents affected mobile internet (44% of all reported incidents). Mobile internet and mobile telephony were the predominant affected services in the previous years also, except for 2014 where fixed telephony was the most affected.
- Impact on emergency calls: In 15 % of the incidents there were problems in reaching the 112 emergency services, a small decrease since the previous year.
- System failures are the dominant root cause of incidents: Most incidents were caused by system failures or technical failures (70 % of the incidents) as a root cause. This has been the dominant root cause for all the reporting years so far. In the system failures category, software bugs and hardware failures were the most common causes affecting switches and routers, and mobile base stations.
- Human errors affected on average more user connections per incident: In 2015 human errors was the root cause category involving most users affected, around 2.6 million user connections on average per incident. The second place was taken by system failures with 2.4 million user connections on average per incident.
- Malicious actions are not focused on causing disruptions: the total number of incidents caused by malicious actions dropped to 2.5% from higher previous values (9.6% in 2014). This may indicate that the malicious actions are not necessarily aiming at causing unavailability of services, but might have other objectives.
- Malicious actions started causing long lasting incidents: Incidents caused by malicious actions (e.g. DDoS), although the volume was not high, had most impact in terms of duration, on average almost two days per incident.
- New services affected: TV broadcasting / Cable TV Networks (14%) and SMS/MMS (13%), public email (5%), IPTV (4,4%), VOIP services (3,7%) were the most affected services among the new ones that started being collected from this year.
These patterns need particular attention when carrying out risk and vulnerability assessments in the electronic communications sector.


Bereits im Bericht 2012 bzw. im Sonderbericht Power Supply Dependencies in the Electronic Communications Sector standen Stromausfälle an dritter Stelle als Ursache für Systemausfälle. Hier ist anscheinend in den letzten Jahren keine wesentliche Verbesserung eingetreten.

Kommentar
Auch wenn dieser Bericht klar aufzeigt, dass die Hauptursache für Systemausfälle im Telekommunikationssektor Systemfehler und menschliches Versagen sind, sollten die aktuellen Eskalationen nicht unterschätzt werden. Denn während die Folgen der hier aufgezeigten Ausfälle eher begrenzt bleiben, können durch schwere Cyber-Angriffe/-vorfälle Kettenreaktionen mit nicht absehbaren Folgen ausgelöst werden. Wie immer gilt auch hier ein sowohl-als-auch-Denken, bzw. die Ambivalenz, die zu beachten ist.
2014
Quelle: www.enisa.europa.eu
Electronic communications are the backbone of the EU’s digital society. Article 13a of the EU’s electronic communications Framework directive asks EU Member States to ensure the security and resilience of public electronic communications networks and services. As part of the implementation of Article 13a, National Regulatory Authorities (NRAs) in the EU collect reports about incidents with a significant impact on the electronic communications networks and services. Yearly, ENISA publishes an annual report which summarizes these incident reports and provides an aggregate analysis of major outages. As can be seen in the ENISA annual report, power cuts are a dominant cause of severe network and service outages in the EU’s electronic communications sector. In the report “Power Supply Dependencies in the Electronic Communications Sector”, we study these incidents in more detail and we make recommendations to NRAs and electronic communications service providers and to some extent also to actors in the energy sector as well as civil protection authorities. Our recommendations are aimed at improving the electronic communications sector’s ability to withstand and act efficiently after power cuts.
The diagram below shows the average impact per cause per reported incident from 2012. The impact is calculated as affected user connections times the duration of the incidents in hours.
We found that:
- A majority of EU Member States have implemented more general resilience policies through legislation, whereas a minority of the Member States have implemented policies that are directly linked to resilience against power cuts.
- A majority of the NRAs do not and may even lack suitable input to perform risk assessments that include power cuts. It is also noted that the national use of state funding and publicprivate partnerships to address power cut resilience are exceptions rather than the norm within the EU.
- Resilience against power cuts is lower in access networks closer to customers than for network elements that carry traffic for a large number of customers. Mobile networks tend to be more vulnerable to power cuts compared to fixed networks.
- A majority of NRAs believe that current protection levels are not adequate and they would like to see power cut resilience to become a market differentiating factor for network and providers.
- A review of incident reports from 2011 and 2012 shows that a significant number of power cuts led to more severe service disruptions than what would have been the case had existing protection measures worked as intended.
Zuletzt aktualisiert am 07. August 2025 um 18:10


Trackbacks/Pingbacks